
Page 167 - Keller FY20 Approved Budget
P. 167
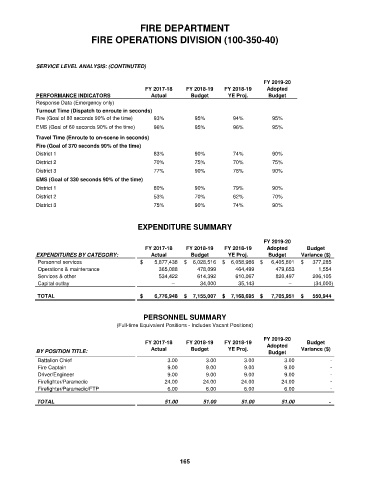
FIRE DEPARTMENT
                               FIRE OPERATIONS DIVISION (100-350-40)


             SERVICE LEVEL ANALYSIS: (CONTINUTED)

                                                                                        FY 2019-20
                                                 FY 2017-18    FY 2018-19   FY 2018-19   Adopted
             PERFORMANCE INDICATORS                Actual       Budget      YE Proj.      Budget
             Response Data (Emergency only)
             Turnout Time (Dispatch to enroute in seconds)
             Fire (Goal of 80 seconds 90% of the time)  93%      95%          94%          95%
             EMS (Goal of 60 seconds 90% of the time)  96%       95%          96%          95%
             Travel Time (Enroute to on-scene in seconds)
             Fire (Goal of 370 seconds 90% of the time)
             District 1                             83%          90%          74%          90%
             District 2                             70%          75%          70%          75%
             District 3                             77%          90%          78%          90%
             EMS (Goal of 330 seconds 90% of the time)
             District 1                             80%          90%          79%          90%
             District 2                             53%          70%          62%          70%
             District 3                             75%          90%          74%          90%


                                               EXPENDITURE SUMMARY

                                                                                        FY 2019-20
                                                 FY 2017-18    FY 2018-19   FY 2018-19   Adopted       Budget
             EXPENDITURES BY CATEGORY:             Actual       Budget      YE Proj.      Budget     Variance ($)

              Personnel services               $           5,877,438  $      6,028,516  $      6,058,986  $       6,405,801  $        377,285

              Operations & maintenance                       365,088             478,099             464,499              479,653                1,554


              Services & other                               534,422             614,392             610,067              820,497            206,105
              Capital outlay                                          –                 34,000               35,143                       –             (34,000)

             TOTAL                             $           6,776,948  $      7,155,007  $      7,168,695  $         7,705,951  $        550,944
                                                 PERSONNEL SUMMARY
                                        (Full-time Equivalent Positions - Includes Vacant Positions)

                                                                                        FY 2019-20
                                                 FY 2017-18    FY 2018-19   FY 2018-19   Adopted       Budget
             BY POSITION TITLE:                    Actual       Budget      YE Proj.      Budget     Variance ($)

              Battalion Chief                                       3.00                   3.00                   3.00                    3.00                       -

              Fire Captain                                          9.00                   9.00                   9.00                    9.00                       -

              Driver/Engineer                                       9.00                   9.00                   9.00                    9.00                       -
              Firefighter/Paramedic                               24.00                 24.00                 24.00                  24.00                       -


              Firefighter/Paramedic/FTP                              6.00                   6.00                   6.00                    6.00                       -
             TOTAL                                               51.00                 51.00                 51.00                  51.00                      -


                                                             165