Page 35 - Grapevine FY20 Approved Budget
P. 35

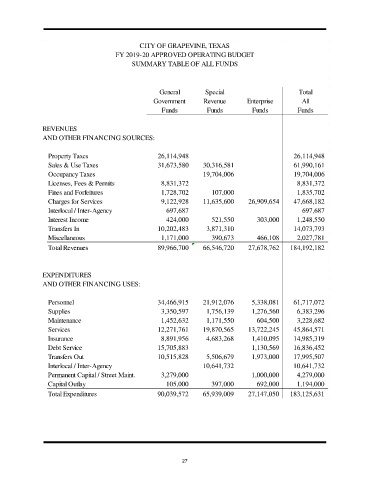
CITY OF GRAPEVINE, TEXAS
                                       FY 2019-20 APPROVED OPERATING BUDGET
                                             SUMMARY TABLE OF ALL FUNDS


                                                      General        Special                        Total
                                                    Government      Revenue        Enterprise        All
                                                       Funds         Funds          Funds          Funds


               REVENUES
               AND OTHER FINANCING SOURCES:


                 Property Taxes                      26,114,948                                   26,114,948
                 Sales & Use Taxes                   31,673,580     30,316,581                    61,990,161
                 Occupancy Taxes                                    19,704,006                    19,704,006
                 Licenses, Fees & Permits             8,831,372                                    8,831,372
                 Fines and Forfeitures                1,728,702        107,000                     1,835,702
                 Charges for Services                 9,122,928     11,635,600     26,909,654     47,668,182
                 Interlocal / Inter-Agency              697,687                                      697,687
                 Interest Income                        424,000        521,550        303,000      1,248,550
                 Transfers In                        10,202,483      3,871,310                    14,073,793
                 Miscellaneous                        1,171,000        390,673        466,108      2,027,781
                 Total Revenues                      89,966,700     66,546,720     27,678,762    184,192,182


               EXPENDITURES
               AND OTHER FINANCING USES:

                 Personnel                           34,466,915     21,912,076      5,338,081     61,717,072
                 Supplies                             3,350,597      1,756,139      1,276,560      6,383,296
                 Maintenance                          1,452,632      1,171,550        604,500      3,228,682
                 Services                            12,271,761     19,870,565     13,722,245     45,864,571
                 Insurance                            8,891,956      4,683,268      1,410,095     14,985,319
                 Debt Service                        15,705,883                     1,130,569     16,836,452
                 Transfers Out                       10,515,828      5,506,679      1,973,000     17,995,507
                 Interlocal / Inter-Agency                          10,641,732                    10,641,732
                 Permanent Capital / Street Maint.    3,279,000                     1,000,000      4,279,000
                 Capital Outlay                         105,000        397,000        692,000      1,194,000
                 Total Expenditures                  90,039,572     65,939,009     27,147,050    183,125,631


                                                             27
   30   31   32   33   34   35   36   37   38   39   40