
Page 176 - Grapevine FY20 Approved Budget
P. 176
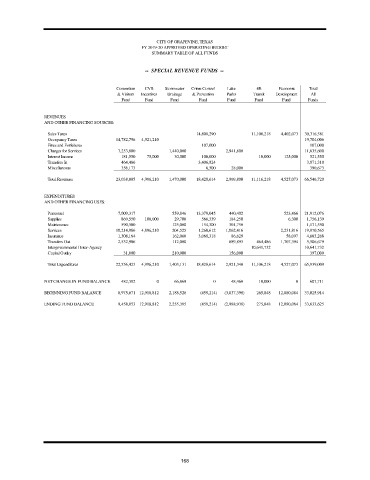
CITY OF GRAPEVINE, TEXAS
                                                FY 2019-20 APPROVED OPERATING BUDGET
                                                   SUMMARY TABLE OF ALL FUNDS


                                                 --  SPECIAL REVENUE FUNDS  --


                                        Convention  CVB  Stormwater  Crime Control  Lake  4B   Economic  Total
                                        & Visitors  Incentives  Drainage  & Prevention  Parks  Transit  Development  All
                                         Fund    Fund    Fund      Fund     Fund     Fund     Fund     Funds


                REVENUES
                AND OTHER FINANCING SOURCES:
                 Sales Taxes                                      14,808,290        11,106,218  4,402,073  30,316,581
                 Occupancy Taxes       14,782,796  4,921,210                                          19,704,006
                 Fines and Forfeitures                              107,000                             107,000
                 Charges for Services   7,253,800        1,440,000          2,941,800                 11,635,600
                 Interest Income         181,550  75,000   30,000   100,000            10,000  125,000  521,550
                 Transfers In            464,486                   3,406,824                          3,871,310
                 Miscellaneous           356,173                     6,500    28,000                    390,673
                 Total Revenues        23,038,805  4,996,210  1,470,000  18,428,614  2,969,800  11,116,218  4,527,073  66,546,720


                EXPENDITURES
                AND OTHER FINANCING USES:
                 Personnel              7,009,317         559,846  13,379,045  440,402         523,466  21,912,076
                 Supplies                869,550  100,000  29,700   566,339  184,250            6,300  1,756,139
                 Maintenance             590,500          125,000   154,300  301,750                  1,171,550
                 Services              10,214,986  4,896,210  204,525  1,260,612  1,062,416   2,231,816  19,870,565
                 Insurance              1,308,164         162,060  3,068,318  86,629            58,097  4,683,268
                 Transfers Out          2,532,906         112,000            689,893  464,486  1,707,394  5,506,679
                 Intergovernmental / Inter-Agency                                   10,641,732        10,641,732
                 Capital Outlay           31,000          210,000            156,000                    397,000
                 Total Expenditures    22,556,423  4,996,210  1,403,131  18,428,614  2,921,340  11,106,218  4,527,073  65,939,009

                NET CHANGE IN FUND BALANCE  482,382  0     66,869       0     48,460   10,000      0    607,711

                BEGINNING FUND BALANCE  8,975,671 12,918,812  2,188,526  (459,214)  (3,037,398)  265,848  12,080,084  33,025,914
                ENDING FUND BALANCE     9,458,053 12,918,812  2,255,395  (459,214)  (2,988,938)  275,848  12,080,084  33,633,625


                                                             168