Page 7 - Dalworthington Gardens FY20 Approved Budget
P. 7

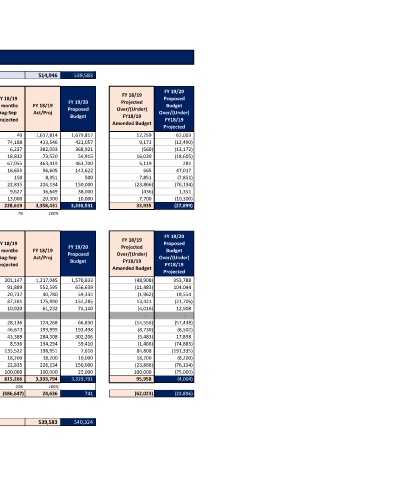
110-GENERAL FUND SUMMARY

 Beginning Fund Balance              758,805             570,701             514,946            514,946           539,583

                                           FY 19/20
                                FY 18/19
 FY 18/19                                  Proposed
 FY 18/19   FY 18/19     10   FY 19/20   Projected
 FY 13/14       FY 14/15       FY 15/16       FY 16/17       FY 17/18       2 months            FY 18/19                                                        Budget
 REVENUE CATEGORY  Amended   months              Proposed   Over/(Under)
 Actual  Actual  Actual  Actual  Actual  Aug-Sep    Act/Proj  Over/(Under)
 Budget  Sep - Jul Actual  Budget    FY18/19
 Projected                                 FY18/19
                              Amended Budget
                                           Projected
 Property Tax                  678,172                665,321                674,873                799,279                966,050             1,605,555            1,617,775                        40            1,617,814          1,679,817                         12,259                   62,003

 Sales & Use Tax                  371,390                400,574                392,561                396,127                404,027                424,374              359,358                74,188              433,546              421,057                          9,173                  (12,490)
 Franchise Fees                  397,735                374,093                367,094                359,645                340,612                382,652              375,856                  6,237              382,093              368,921                            (560)                 (13,172)


 Licenses & Permits                    69,747                    64,832                165,018                198,685                  97,791                  57,490                54,688                18,832                73,520                54,915                        16,030                  (18,605)

 Fines & Fees                  721,697                675,475                515,604                496,368                488,795                458,300              396,364                67,055              463,419              463,700                          5,119                         281


 Service Charges & Fees                    44,395                    45,950                    44,245                  51,050                    57,993                  95,940                 79,950                16,655                96,605              143,622                              665                     47,017

 Donations                       1,499                    2,980                          50                  10,969                  11,829                        500                  8,201                      150                  8,351                      500                          7,851                    (7,851)


 Gas Royalties                  227,154                650,113                497,937                397,197                306,034                250,000              203,298                22,835              226,134              150,000                      (23,866)                 (76,134)


 Miscellaneous Revenue                    41,186                    18,849                    9,059                    31,468                  33,527                  37,085                 27,021                  9,627                36,649                38,000                            (436)                     1,351

 Other Sources                      41,324                         -                         -                    5,886                115,428                  12,600                   7,300                 13,000                20,300                10,000                          7,700                  (10,300)

 TOTAL REVENUE                2,594,297            2,898,185            2,666,441              2,746,675             2,822,085            3,324,496          3,129,811               228,619          3,358,431          3,330,531                         33,935                  (27,899)


 93%  7%     100%
                                           FY 19/20
                                FY 18/19
 FY 18/19                                  Proposed
 FY 18/19   FY 18/19     10   FY 19/20   Projected
 FY 16/17       FY 17/18       2 months            FY 18/19                                                        Budget
 EXPENSE CATEGORY  Amended   months              Proposed   Over/(Under)
 Actual  Actual  Aug-Sep    Act/Proj      Over/(Under)
 Budget  Sep - Jul Actual  Budget    FY18/19
 Projected                                 FY18/19
                              Amended Budget
                                           Projected


 Personnel Salary & Wages             1,357,374             1,261,127             1,265,953            1,015,897              201,147            1,217,045          1,570,833                      (48,908)                353,788
 Personnel Taxes & Benefits                613,606                588,324                564,078              460,706                91,889              552,595              656,639                      (11,483)                104,044


 Training & Travel                  30,785                      7,585                    42,742                20,043                20,737                40,780                59,334                         (1,962)                   18,554
 Materials & Supplies                    88,672                100,279                162,569                88,708                87,281              175,990              154,285                        13,421                  (21,705)

 Utilities                  84,882                    75,634                  65,248                50,312                10,920                61,232                74,140                         (4,016)                   12,908

 Bad Debt                        533                              -                          -
 Maintenance                  58,429                    86,210                138,824                96,132                28,136              124,268                66,830                      (14,556)                 (57,438)


 Consultants                272,310                214,491                208,729              153,326                46,673              199,999              193,498                         (8,730)                   (6,502)
 Contractual                271,238                296,798                289,791              240,919                43,389              284,308              302,206                         (5,483)                   17,898
 Other Expenses                118,555                128,228                135,760              125,758                  8,536              134,294                59,410                         (1,466)                 (74,883)
 Capital Outlay                         -                119,163                114,143                63,429              135,522              198,951                  7,616                        84,808                (191,335)
 Other Uses                    38,395                         -                         -                      -                  18,200                18,200                10,000                        18,200                    (8,200)
 Transfer to Gas Reserve                         -                         -                250,000              203,298                22,835              226,134              150,000                      (23,866)                 (76,134)

 Transfer to Fire Truck Fund                         -                         -                         -                      -                100,000              100,000                25,000                       100,000                  (75,000)


 TOTAL EXPENSES            2,934,778              2,877,839              3,237,837          2,518,528             815,266          3,333,794          3,329,791                         95,958                    (4,004)

 76%  24%    100%


 REVENUE OVER EXPENSES              (188,104)                (55,754)                 86,659              611,283            (586,647)               24,636                     741                      (62,023)                 (23,896)
 ENDING FUND BALANCE              570,701             514,946             601,606              539,583           540,324
   2   3   4   5   6   7   8   9   10   11   12