Page 113 - Benbrook FY20 Approved Budget
P. 113

CITY OF BENBROOK 2019-20 ANNUAL BUDGET
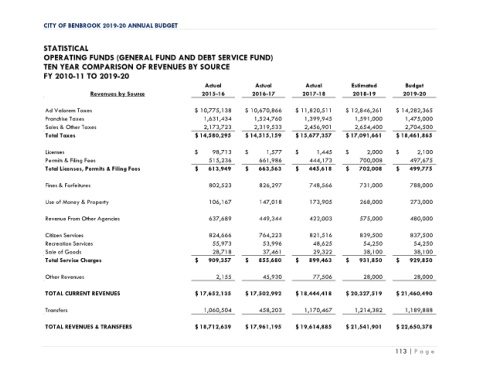


               STATISTICAL
               OPERATING FUNDS (GENERAL FUND AND DEBT SERVICE FUND)
               TEN YEAR COMPARISON OF REVENUES BY SOURCE
               FY 2010-11 TO 2019-20
                                                                     Actual          Actual           Actual         Estimated         Budget
                               Revenues by Source                   2015-16         2016-17          2017-18         2018-19          2019-20

                Ad Valorem Taxes                                 $   10,775,138   $   10,670,866  $   11,820,511   $   12,846,261   $   14,282,365
                Franchise Taxes                                     1,631,434        1,524,760       1,399,945            1,591,000         1,475,000
                Sales & Other Taxes                                 2,173,723        2,319,533       2,456,901            2,654,400         2,704,500
                Total Taxes                                      $  14,580,295    $  14,515,159    $  15,677,357   $  17,091,661    $  18,461,865


                Licenses                                         $           98,713  $             1,577  $             1,445  $             2,000  $             2,100
                Permits & Filing Fees                                 515,236          661,986         444,173                700,008              497,675
                Total Licenses, Permits & Filing Fees            $        613,949  $        663,563  $        445,618  $        702,008  $        499,775


                Fines & Forfeitures                                   802,523          826,297         748,566          731,000         788,000

                Use of Money & Property                               106,167          147,018         173,905                268,000              273,000

                Revenue From Other Agencies                           637,689          449,344         422,003                575,000              480,000


                Citizen Services                                      824,666          764,223         821,516                839,500              837,500
                Recreation Services                                    55,973           53,996          48,625                  54,250               54,250
                Sale of Goods                                          28,718           37,461          29,322                  38,100               38,100
                Total Service Charges                            $        909,357  $        855,680  $        899,463  $        931,850  $        929,850

                Other Revenues                                          2,155           45,930          77,506                  28,000                28,000


                TOTAL CURRENT REVENUES                           $  17,652,135    $  17,502,992    $  18,444,418   $  20,327,519    $  21,460,490

                Transfers                                           1,060,504          458,203       1,170,467            1,214,382         1,189,888


                TOTAL REVENUES & TRANSFERS                       $  18,712,639    $  17,961,195    $  19,614,885   $  21,541,901    $  22,650,378


                                                                                                                                   113 | P a g e
   108   109   110   111   112   113   114   115   116   117   118