
Page 327 - City of Bedford FY20 Approved Budget
P. 327
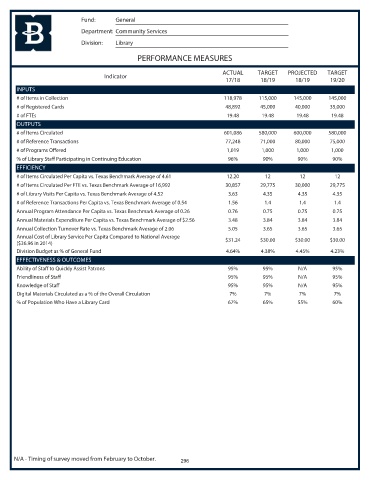
Fund:      General
                            Department: Community Services
                            Division:  Library

                                               PERFORMANCE MEASURES

                                                                           ACTUAL     TARGET    PROJECTED    TARGET
                                    Indicator
                                                                            17/18      18/19       18/19      19/20
       INPUTS
       # of Items in Collection                                            118,978     115,000    145,000     145,000
       # of Registered Cards                                                48,892     45,000      40,000     35,000
       # of FTEs                                                            19.48       19.48      19.48       19.48
       OUTPUTS
       # of Items Circulated                                               601,086     580,000    600,000     580,000
       # of Reference Transactions                                          77,248     71,000      80,000     75,000
       # of Programs Offered                                                1,019       1,000      1,000       1,000
       % of Library Staff Participating in Continuing Education             96%         90%         90%        90%
       EFFICIENCY
       # of Items Circulated Per Capita vs. Texas Benchmark Average of 4.61  12.20       12         12          12
       # of Items Circulated Per FTE vs. Texas Benchmark Average of 16,992  30,857     29,775      30,000     29,775
       # of Library Visits Per Capita vs. Texas Benchmark Average of 4.52    3.63       4.35        4.35       4.35
       # of Reference Transactions Per Capita vs. Texas Benchmark Average of 0.54  1.56  1.4        1.4         1.4
       Annual Program Attendance Per Capita vs. Texas Benchmark Average of 0.26  0.76   0.75        0.75       0.75
       Annual Materials Expenditure Per Capita vs. Texas Benchmark Average of $2.56  3.48  3.84     3.84       3.84
       Annual Collection Turnover Rate vs. Texas Benchmark Average of 2.06   5.05       3.65        3.65       3.65
       Annual Cost of Library Service Per Capita Compared to National Average
                                                                            $31.24     $30.00      $30.00     $30.00
       ($36.96 in 2014)
       Division Budget as % of General Fund                                 4.64%      4.38%       4.45%      4.23%
       EFFECTIVENESS & OUTCOMES
       Ability of Staff to Quickly Assist Patrons                           95%         95%         N/A        95%
       Friendliness of Staff                                                95%         95%         N/A        95%
       Knowledge of Staff                                                   95%         95%         N/A        95%
       Digital Materials Circulated as a % of the Overall Circulation        7%         7%          7%         7%
       % of Population Who Have a Library Card                              67%         65%         55%        60%


      N/A - Timing of survey moved from February to October.  296