Page 261 - Ord 866 Adopting a revised Fiscal Year 17-18 and new proposed Fiscal Year 18-19 budget
P. 261

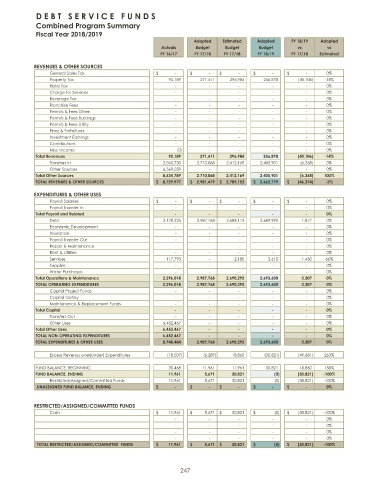
D E B T S E R V I C E F U N D S
             Combined Program Summary
             Fiscal Year 2018/2019
                                                                 Adopted  Estimated   Adopted    FY 18/ 19  Adopted
                                                      Actuals     Budget   Budget      Budget      vs        vs
                                                      FY 16/ 17  FY 17/ 18  FY 17/ 18  FY 18/ 19  FY 17/ 18  Estimated
            REVENUES &  OTHER SOURCES
                 General Sales Tax -$               -$               -$               -$               -$                 0%
                 Property Tax                            95,189    271,411   296,984    256,878          (  40,106)          -14%
                 Hotel Tax -                 -                 -                 -                 -                   0%
                 Charge for Services -                 -                 -                 -                 -                   0%
                 Beverage Tax -                 -                 -                 -                 -                   0%
                 Franchise Fees -                 -                 -                 -                 -                   0%
                 Permits &  Fees Other -                 -                 -                 -                 -                   0%
                 Permits &  Fees Buildings -                 -                 -                 -                 -                   0%
                 Permits &  Fees Utility -                 -                 -                 -                 -                   0%
                 Fines &  Forfeitures -                 -                 -                 -                 -                   0%
                 Investment Earnings -                 -                 -                 -                 -                   0%
                 Contributions -                 -                 -                 -                 -                   0%
                 Misc Income (                              0)                   -                 -                 -                 -                   0%
             Total Revenues                              95, 189   271, 411  296, 984   256, 878         (  40,106)          - 14%
                 Transfers In                          2,065, 730  2,710, 068  2,412, 169  2,405, 901       (  6,268)             0%
                 Other Sources                         6,569, 059       -                 -                 -                 -                   0%
             Total Other Sources                       8,634, 789  2,710, 068  2,412, 169  2,405, 901      (  6,268)            100%
             TOTAL REVENUES &   OTHER SOURCES          8,729, 977$       2,981, 479$       2,709, 153$       2,662, 779$     (  46,374)$        -  2%

            EXPENDITURES &  OTHER USES
                 Payroll Salaries -$               -$               -$               -$               -$                 0%
                 Payroll Transfer In -                 -                 -                 -                 -                   0%
             Total Payroll and Related -                 -                 -                 -                 -                   0%
                 Debt                                  2,178, 225  2,987, 768  2,688, 113  2,689, 990  1,877  0%
                 Economic  Development -                 -                 -                 -                 -                   0%
                 Insurance -                 -                 -                 -                 -                   0%
                 Payroll Transfer Out -                 -                 -                 -                 -                   0%
                 Repair &  Maintenance -                 -                 -                 -                 -                   0%
                 Rent &  Utilities -                 -                 -                 -                 -                   0%
                 Services                               117, 793          -                   2,180  3,610  1,430  66%
                 Supplies -                 -                 -                 -                 -                   0%
                 Water Purchases -                 -                 -                 -                 -                   0%
             Total Operations &  Maintenance           2,296, 018  2,987, 768  2,690, 293  2,693, 600  3,307  0%
             TOTAL OPERATING  EXPENDITURES             2,296, 018  2,987, 768  2,690, 293  2,693, 600  3,307  0%
                 Capital Project Funds -                 -                 -                 -                 -                   0%
                 Capital Outlay -                 -                 -                 -                 -                   0%
                 Maintenance &   Replacement  Funds -                 -                 -                 -                 -                   0%
             Total Capital -                 -                 -                 -                 -                   0%
                 Transfers Out -                 -                 -                 -                 -                   0%
                 Other Uses                            6,452, 467       -                 -                 -                 -                   0%
             Total Other Uses                          6,452, 467      -                 -                 -                 -                   0%
             TOTAL NON- OPERATING  EXPENDITURES        6,452, 467      -                 -                 -                 -                   0%
             TOTAL EXPENDITURES &   OTHER USES         8,748, 484  2,987, 768  2,690, 293  2,693, 600  3,307  0%

                 Excess Revenus over( under)  Expenditures (  18, 507)          (  6,289)              18, 860            (  30,821)          (  49, 681)           263%

             FUND BALANCE,  BEGINNING                    30, 468    11,961    11, 961    30,821     18, 860  158%
             FUND BALANCE,  ENDING                       11, 961     5,671    30, 821           (  0)                   (30,821)          - 100%
                 Restricted/ Assigned/ Committed  Funds  11, 961     5,671    30, 821            (  0)                   (30, 821)          - 100%
             UNASSIGNED  FUND BALANCE,  ENDING -$               -$               -$               -$               -$                 0%

            RESTRICTED/ ASSIGNED/ COMMITTED FUNDS
                 Cash                                    11, 961$            5,671$              30, 821$          (  0)$                 (30, 821)$        - 100%
                                                                                                             0%
                                                                                                             0%
                                                                                                             0%
                                                                                                             0%
             TOTAL RESTRICTED/ ASSIGNED/ COMMITTED FUNDS  11,961$           5,671$            30,821$         (  0)$                 (30,821)$        -100%


                                                             247
   256   257   258   259   260   261   262   263   264   265   266