
Page 135 - Ord 866 Adopting a revised Fiscal Year 17-18 and new proposed Fiscal Year 18-19 budget
P. 135
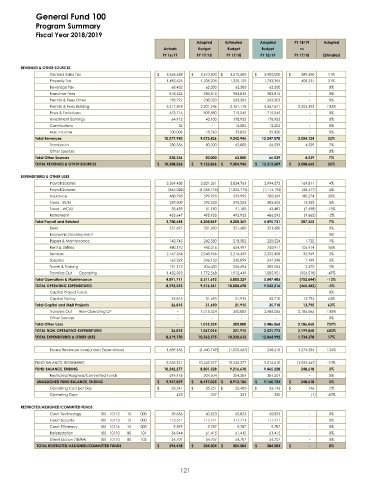
General Fund 100
             Program Summary
             Fiscal Year 2018/2019
                                                                  Adopted  Estimated   Adopted    FY 18/ 19  Adopted
                                                       Actuals    Budget    Budget     Budget       vs
                                                       FY 16/ 17  FY 17/ 18  FY 17/ 18  FY 18/ 19  FY 17/ 18  Estimated

        REVENUES &  OTHER SOURCES
                 General Sales Tax                      3,353,658$          3,510,500$         3,510,500$          3,900,000$          389,500$            11%
                 Property Tax                           1,482,625  1,205,205  1,325,125  1,733,356   408,231  31%
                 Beverage Tax                             68,432     62,500    62,500     62,500               -                       0%
                 Franchise Fees                          818,422    983,815   983,815    983,815             -                       0%
                 Permits &  Fees Other                   198,792    238,020   263,303    263,303             -                       0%
                 Permits &  Fees Building               3,317,394  2,201,246  2,151,178  4,357,571  2,206,393  103%
                 Fines &  Forfeitures                    673,716    809,880   715,545    715,545             -                       0%
                 Investment Earnings                      64,913     43,100   178,955    178,955             -                       0%
                 Contributions                              32                      -                       12,205  12,205               -                       0%
                 Misc Income                             100,006     18,560    39,820     39,820               -                       0%
             Total Revenues                            10,077,990  9,072,826  9,242,946  12,247,070  3,004,124  33%
                 Transfers In                            230,336     50,000    62,000     66,539      4,539   7%
                 Other Sources -                     -                     -                     -                     -                       0%
             Total Other Sources                         230,336     50,000    62,000     66,539      4,539   7%
             TOTAL REVENUES &  OTHER SOURCES           10,308,326$        9,122,826$         9,304,946$          12,313,609$        3,008,663$          32%
        EXPENDITURES &  OTHER USES
                 Payroll Salaries                       3,369,458  3,821,261  3,824,761  3,994,572   169,811  4%
                 Payroll Salaries (                      864,028)            (  1,055,775)         ( 1,055,775)         (  1,114,192)         (  58,417)              6%
                 Insurance                               488,798    599,995   599,995    780,269     180,274  30%
                 Taxes - SS/ M                           239,309    292,253   292,253    305,506     13,253   5%
                 Taxes - WC/ U                            33,459     51,180    51,180     43,482               (  7,698)                -15%
                 Retirement                              433,647    495,955   495,955    486,093             (  9,862)                -2%
             Total Payroll and Related                  3,700,644  4,204,869  4,208,369  4,495,731  287,362   7%
                 Debt                                    351,697    351,680   351,680    351,680             -                       0%
                 Economic Development -                     -                     -                     -                     -                       0%
                 Repair &  Maintenance                   143,745    242,580   218,502    220,224      1,722   1%
                 Rent & Utilities                        480,170    445,316   654,497    760,911     106,414  16%
                 Services                               2,167,264  2,048,966  2,216,439  2,252,408   35,969   2%
                 Supplies                                165,329    246,152   240,099    247,298      7,199   3%
                 Travel &  Training                      131,112    204,430   206,694    209,064      2,370   1%
                 Transfers Out  Operating               1,452,393  1,772,568  1,912,419  1,005,901          (  906,518)            -47%
             Total Operations & Maintenance             4,891,711  5,311,692  5,800,329  5,047,485          (  752,844)           - 13%
             TOTAL OPERATING EXPENDITURES               8,592,355  9,516,561  10,008,698  9,543,216          (  465,482)           - 5%
                 Capital Project Funds -                     -                     -                     -                     -                       0%
                 Capital Outlay                           26,815     31,690    21,915     35,710     13,795  63%
             Total Capital and M&R Projects               26,815     31,690    21,915     35,710     13,795  63%
                 Transfers Out  Non-Operating CP -                       1,015,324  300,000  2,486,065  2,186,065  100%
                 Other Sources -                     -                     -                     -                     -                       0%
             Total Other Uses -                                    1,015,324  300,000   2,486,065  2,186,065  729%
             TOTAL NON-OPERATING EXPENDITURES             26,815   1,047,014  321,915   2,521,775  2,199,860  683%
             TOTAL EXPENDITURES &  OTHER USES           8,619,170  10,563,575  10,330,613  12,064,992  1,734,378  17%

                 Excess Revenues over(under) Expenditures  1,689,156          (  1,440,749)         ( 1,025,667)           248,618  1,274,285  124%
             FUND BALANCE,  BEGINNING                   8,553,121  10,242,277  10,242,277  9,216,610          (  1,025,667)         - 10%
             FUND BALANCE,  ENDING                     10,242,277  8,801,528  9,216,610  9,465,228  248,618   3%
                 Restricted/ Assigned/ Committed Funds   294,418    304,504   304,504    304,504             -                       0%
             UNASSIGNED FUND BALANCE,  ENDING           9,947,859$          8,497,025$         8,912,106$          9,160,724$          248,618$            3%
                                                                                                              5%
                 Operating Cost per Day                   23,541$               25,251$              25,400$               26,146$               746$                  -
                                                                                                              60%
                 Operating Days                            423         337      351         350                    (  1)                       -
        RESTRICTED/ ASSIGNED/ COMMITED FUNDS
                 Court Technology  100 10112  15  000     59,656     60,823    60,823     60,823               -                       0%
                 Court Security   100 10113  15  000     115,511    117,771   117,771    117,771             -                       0%
                 Court Efficiency  100 10116  15  000     9,599       9,787    9,787       9,787                 -                       0%
                 Reforestation    100 10110  00  101      54,944     61,415    61,415     61,415               -                       0%
                 Street Escrow ( TB/ RA)  100 10110  00  102  54,707  54,707   54,707     54,707               -                       0%
             TOTAL RESTRICTED/ ASSIGNED/ COMMITTED FUNDS  294,418$             304,504$             304,504$             304,504$           -$                    0%


                                                             121