Page 427 - Cover 3.psd
P. 427

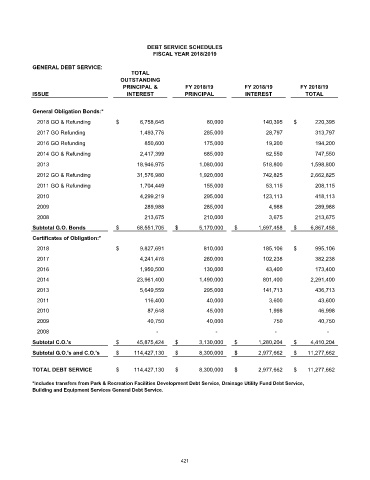
DEBT SERVICE SCHEDULES
                                                    FISCAL YEAR 2018/2019

            GENERAL DEBT SERVICE:
                                            TOTAL
                                         OUTSTANDING
                                          PRINCIPAL &         FY 2018/19          FY 2018/19        FY 2018/19
            ISSUE                          INTEREST           PRINCIPAL           INTEREST            TOTAL

            General Obligation Bonds:*
             2018 GO & Refunding       $               6,758,645       80,000             140,395  $              220,395

             2017 GO Refunding                   1,493,776          285,000              28,797          313,797
             2016 GO Refunding                     850,600          175,000              19,200          194,200
             2014 GO & Refunding                 2,417,399            685,000              62,550        747,550
             2013                               18,946,975           1,080,000            518,800       1,598,800

             2012 GO & Refunding                31,576,980           1,920,000            742,825       2,662,825
             2011 GO & Refunding                 1,704,449            155,000              53,115        208,115
             2010                                4,299,219            295,000             123,113        418,113
             2009                                  289,988            285,000               4,988        289,988
             2008                                  213,675            210,000               3,675        213,675
            Subtotal G.O. Bonds        $             68,551,705  $               5,170,000  $               1,697,458  $           6,867,458
            Certificates of Obligation:*

             2018                      $               9,827,691      810,000             185,106  $              995,106

             2017                                4,241,476            280,000             102,238        382,238
             2016                                1,950,500            130,000              43,400          173,400
             2014                               23,961,400           1,490,000            801,400               2,291,400
             2013                                5,649,559            295,000             141,713          436,713
             2011                                  116,400             40,000               3,600           43,600

             2010                                   87,648             45,000               1,998           46,998
             2009                                   40,750             40,000                750            40,750
             2008                                    -                  -                   -                -
            Subtotal C.O.'s            $             45,875,424  $               3,130,000  $               1,280,204  $           4,410,204
            Subtotal G.O.'s and C.O.'s  $           114,427,130  $               8,300,000  $               2,977,662  $         11,277,662


            TOTAL DEBT SERVICE         $           114,427,130  $               8,300,000  $               2,977,662  $         11,277,662
            *Includes transfers from Park & Recreation Facilities Development Debt Service, Drainage Utility Fund Debt Service,
            Building and Equipment Services General Debt Service.


                                                             421
   422   423   424   425   426   427   428   429   430   431   432