
Page 299 - Mansfield 2019 Operating Budget
P. 299
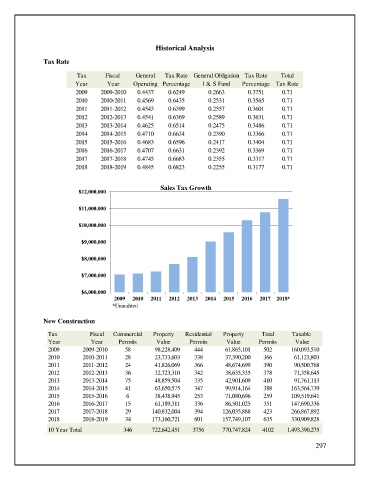
Historical Analysis

               Tax Rate

                          Tax       Fiscal    General   Tax Rate General Obligation Tax Rate  Total
                          Year      Year     Operating Percentage   I & S Fund   Percentage Tax Rate
                          2009    2009-2010   0.4437     0.6249       0.2663       0.3751     0.71
                          2010    2010-2011   0.4569     0.6435       0.2531       0.3565     0.71
                          2011    2011-2012   0.4543     0.6399       0.2557       0.3601     0.71
                          2012    2012-2013   0.4541     0.6369       0.2589       0.3631     0.71
                          2013    2013-2014   0.4625     0.6514       0.2475       0.3486     0.71
                          2014    2014-2015   0.4710     0.6634       0.2390       0.3366     0.71
                          2015    2015-2016   0.4683     0.6596       0.2417       0.3404     0.71
                          2016    2016-2017   0.4707     0.6631       0.2392       0.3369     0.71
                          2017    2017-2018   0.4745     0.6683       0.2355       0.3317     0.71
                          2018    2018-2019   0.4845     0.6823       0.2255       0.3177     0.71


                                                      Sales Tax Growth
                           $12,000,000

                           $11,000,000


                           $10,000,000

                            $9,000,000


                            $8,000,000

                            $7,000,000


                            $6,000,000
                                       2009  2010  2011  2012  2013  2014  2015  2016  2017  2018*
                                            *Unaudited

               New Construction

                 Tax           Fiscal  Commercial   Property  Residential  Property     Total     Taxable
                 Year          Year     Permits      Value      Permits     Value      Permits     Value

                 2009       2009-2010     58            98,228,409  444         61,865,101  502       160,093,510
                 2010       2010-2011     28              23,733,603  338         37,390,200  366         61,123,803
                 2011       2011-2012     24              41,826,069  366         48,674,699  390         90,500,768

                 2012       2012-2013     36            32,723,310  342         38,635,335  378         71,358,645
                 2013       2013-2014     75              48,859,504  335         42,901,609  410         91,761,113
                 2014       2014-2015     41            63,650,575  347         99,914,164  388       163,564,739

                 2015       2015-2016      6              38,438,945  253         71,080,696  259       109,519,641
                 2016       2016-2017     15              61,189,311  336         86,501,025  351       147,690,336
                 2017       2017-2018     29           140,832,004  394       126,035,888  423       266,867,892
                 2018       2018-2019     34           173,160,721  601       157,749,107  635       330,909,828
                 10 Year Total            346           722,642,451  3756       770,747,824  4102     1,493,390,275

                                                                                                         297