
Page 10 - Mansfield 2019 Operating Budget
P. 10
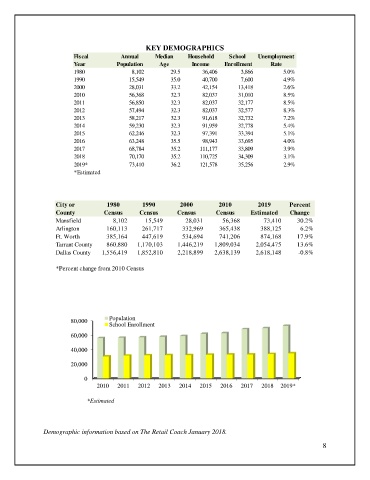
KEY DEMOGRAPHICS
                         Fiscal          Annual     Median     Household     School   Unemployment
                         Year           Population    Age        Income    Enrollment      Rate
                         1980                         8,102  29.5                36,406                3,866  5.0%
                         1990                     15,549  35.0                40,700                7,600  4.9%


                         2000                     28,031  33.2                42,154              13,418  2.6%
                         2010                       56,368  32.3                82,037              31,010  8.5%
                         2011                     56,850  32.3                82,037              32,177  8.5%

                         2012                     57,494  32.3                82,037              32,577  8.3%

                         2013                       58,217  32.3                91,618              32,732  7.2%

                         2014                     59,230  32.3                91,959              32,778  5.4%
                         2015                       62,246  32.3                97,391              33,394  5.1%
                         2016                       63,248  35.5                98,943              33,695  4.0%
                         2017                       68,784  35.2              111,177              33,809  3.9%

                         2018                     70,170  35.2              110,725              34,309  3.1%
                         2019*                      73,410  36.2              121,578              35,256  2.9%
                         *Estimated


                   City or          1980        1990         2000        2010         2019       Percent
                   County          Census      Census       Census      Census      Estimated    Change
                   Mansfield                 8,102           15,549              28,031            56,368               73,410  30.2%
                   Arlington             160,113         261,717            332,969          365,438             388,125  6.2%
                   Ft. Worth             385,164         447,619            534,694          741,206             874,168  17.9%
                   Tarrant County         860,880      1,170,103         1,446,219       1,809,034          2,054,475  13.6%
                   Dallas County      1,556,419      1,852,810         2,218,899       2,638,139          2,618,148  -0.8%

                   *Percent change from 2010 Census


                        80,000       Population
                                     School Enrollment
                        60,000

                        40,000

                        20,000

                             0
                                 2010   2011   2012  2013   2014   2015   2016   2017   2018  2019*

                              *Estimated


               Demographic information based on The Retail Coach January 2018.

                                                                                                            8