
Page 85 - Hurst FY19 Approved Budget
P. 85
MYFP 2022-23 15,312,717 8,162,145 575,000 400,000 0 90,000 25,000 $24,564,862 $24,016,386 $1,115,166 $0 $25,131,552 $1,760,159 $23,371,393 1,193,469 1,000,000 5,309,933 250,000 3,521,229 6,196,821 16,277,983
$ $
0
MYFP 2021-22 14,866,716 7,924,412 570,000 400,000 90,000 25,000 $23,876,128 $23,316,880 $1,237,338 $0 $24,554,218 $1,720,159 $22,834,059 1,042,070 1,000,000 4,361,380 250,000 3,418,669 6,054,465 15,084,514
$ $
0
MYFP 2020-21 14,433,705 7,693,604 565,000 400,000 85,000 25,000 $23,202,309 $22,637,747 $1,415,731 $0 $24,053,478 $1,745,159 $22,308,319 893,990 1,000,000 3,542,354 250,000 3,319,096 5,930,995 14,042,445
$ $
0
$0
MYFP 2019-20 14,013,306 7,469,519 560,000 400,000 80,000 25,000 $22,547,824 $21,978,395 $1,532,817 $23,511,212 $1,713,909 $21,797,303 750,521 1,000,000 2,878,746 250,000 3,222,424 5,797,285 13,148,455
$ $
0
PROPOSED BUDGET 2018-19 13,605,151 7,251,960 600,000 378,000 150,000 70,000 $22,055,111 $21,338,248 $1,643,810 $196,066 $23,178,124 $1,690,909 $21,487,215 1,000,000 $ 2,304,213 250,000 3,128,567 5,715,154 12,397,934 $
ESTIMATED BUDGET 2017-18 13,349,295 7,165,258 564,996 335,271 0 0 139,782 32,000 $21,586,602 $20,614,649 $1,760,407 $690,547 $23,065,603 $1,668,738 $21,396,865 189,737 1,000,000 $ 1,815,446 250,000 3,077,183 5,687,409 11,830,038 $
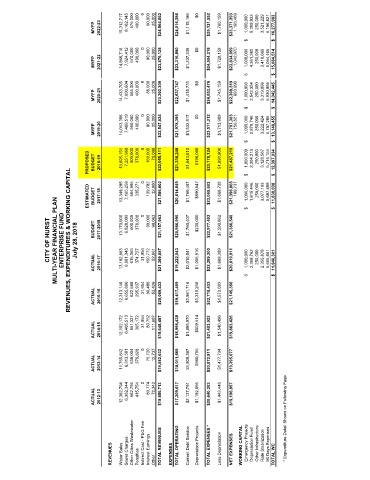
CITY OF HURST MULTI-YEAR FINANCIAL PLAN ENTERPRISE FUND REVENUES, EXPENDITURES & WORKING CAPITAL July 28, 2018 BUDGET ACTUAL 2017-2018 2016-17 13,170,000 13,102,863 6,820,000 6,981,345 600,000 615,365 378,000 374,727 31,954 99,000 150,772 90,063 52,861 $21,157,063 $21,309,887 $20,986,995 $19,222,543 $1,760,407 $2,010,841 $230,000 $1,055,916 $22,977,402 $22,289,300 $1,590,862 $1,669,389 $21,386,540 $20,619,911 1,000,000 2,368,762 250,
ACTUAL 2015-16 12,313,146 6,655,896 622,588 295,937 31,954 96,486 53,426 $20,069,433 $19,417,459 $1,981,716 $1,319,258 $22,718,433 $1,573,083 $21,145,350 $ $
ACTUAL 2014-15 12,102,172 6,405,513 551,327 365,172 31,954 80,752 111,607 $19,648,497 $18,998,438 $1,895,970 $509,514 $21,403,922 $1,540,496 $19,863,426
ACTUAL 2013-14 11,765,842 6,313,501 538,004 376,828 0 75,720 12,737 $19,082,632 $18,011,669 $1,900,387 $960,755 $20,872,811 $1,477,734 $19,395,077
ACTUAL 2012-13 12,362,704 6,362,344 562,795 415,754 0 80,774 72,342 $19,856,713 $17,309,617 $2,137,791 $1,192,895 $20,640,303 $1,443,446 $19,196,857 * Expenditure Detail Shown on Following Page
REVENUES Water Sales Sewer Charges Other Cities Wastewater Penalties Indirect Cost - PEG Fee Interest Earnings Other TOTAL REVENUES EXPENSES TOTAL OPERATING Current Debt Service Depreciation Projects TOTAL EXPENSES * Less Depreciation NET EXPENSES WORKING CAPITAL Emergency Projects Depreciation Fund Other Infrastructure Rate Stabilization 90 Days Expenses TOTAL WC