
Page 160 - Haltom City FY19 Annual Budget
P. 160
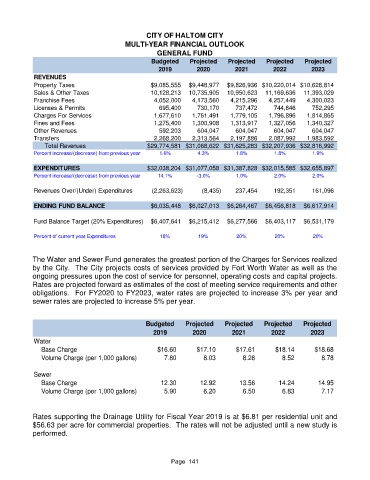
CITY OF HALTOM CITY
                                          MULTI-YEAR FINANCIAL OUTLOOK
                                                     GENERAL FUND
                                                   Budgeted     Projected   Projected    Projected    Projected
                                                     2019         2020         2021        2022         2023
            REVENUES
            Property Taxes                         $9,085,555  $9,448,977   $9,826,936 $10,220,014 $10,628,814
            Sales & Other Taxes                     10,128,213    10,735,905    10,950,623    11,169,636    11,393,029
            Franchise Fees                            4,052,000      4,173,560      4,215,296      4,257,449      4,300,023
            Licenses & Permits                           695,400         730,170         737,472         744,846         752,295
            Charges For Services                      1,677,610      1,761,491      1,779,105      1,796,896      1,814,865
            Fines and Fees                            1,275,400      1,300,908      1,313,917      1,327,056      1,340,327
            Other Revenues                               592,203         604,047         604,047         604,047         604,047
            Transfers                                 2,268,200      2,313,564      2,197,886      2,087,992      1,983,592
                  Total Revenues                  $29,774,581 $31,068,622 $31,625,283 $32,207,936 $32,816,992
            Percent increase/(decrease) from previous year  1.6%  4.3%         1.8%         1.8%        1.9%

            EXPENDITURES                          $32,038,204 $31,077,058 $31,387,828 $32,015,585 $32,655,897
            Percent increase/(decrease) from previous year  14.1%  -3.0%       1.0%         2.0%        2.0%
            Revenues Over/(Under) Expenditures       (2,263,623)           (8,435)        237,454         192,351         161,096


            ENDING FUND BALANCE                    $6,035,448  $6,027,013   $6,264,467   $6,456,818  $6,617,914

            Fund Balance Target (20% Expenditures)  $6,407,641  $6,215,412  $6,277,566   $6,403,117  $6,531,179

            Percent of current year Expenditures      18%          19%         20%          20%          20%


            The Water and Sewer Fund generates the greatest portion of the Charges for Services realized
            by the City.  The City projects costs of services provided by Fort Worth Water as well as the
            ongoing pressures upon the cost of service for personnel, operating costs and capital projects.
            Rates are projected forward as estimates of the cost of meeting service requirements and other
            obligations.  For FY2020 to FY2023, water rates are projected to increase 3% per year and
            sewer rates are projected to increase 5% per year.


                                                 Budgeted     Projected    Projected    Projected    Projected
                                                    2019         2020         2021         2022         2023
            Water
                Base Charge                          $16.60       $17.10       $17.61       $18.14       $18.68
                Volume Charge (per 1,000 gallons)      7.80         8.03         8.28         8.52         8.78

            Sewer
                Base Charge                           12.30        12.92        13.56        14.24        14.95
                Volume Charge (per 1,000 gallons)      5.90         6.20         6.50         6.83         7.17


            Rates supporting the Drainage Utility for Fiscal Year 2019 is at $6.81 per residential unit and
            $56.63 per acre for commercial properties.  The rates will not be adjusted until a new study is
            performed.


                                                          Page  141