
Page 62 - Fort Worth City Budget 2019
P. 62
Budget Highlights
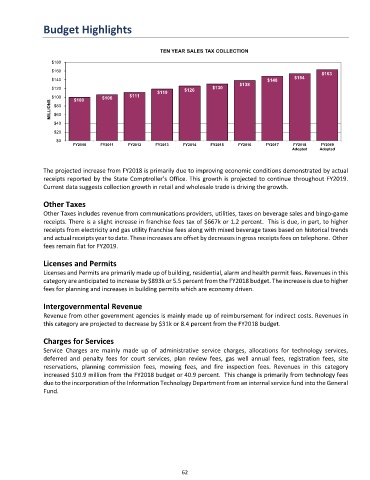
TEN YEAR SALES TAX COLLECTION
$180
$160
$163
$154
$140 $148
$138
$120 $126 $130
$119
$100 $100 $106 $111
MILLIONS $80
$60
$40
$20
$0
FY2010 FY2011 FY2012 FY2013 FY2014 FY2015 FY2016 FY2017 FY2018 FY2019
Adopted Adopted
The projected increase from FY2018 is primarily due to improving economic conditions demonstrated by actual
receipts reported by the State Comptroller’s Office. This growth is projected to continue throughout FY2019.
Current data suggests collection growth in retail and wholesale trade is driving the growth.
Other Taxes
Other Taxes includes revenue from communications providers, utilities, taxes on beverage sales and bingo-game
receipts. There is a slight increase in franchise fees tax of $667k or 1.2 percent. This is due, in part, to higher
receipts from electricity and gas utility franchise fees along with mixed beverage taxes based on historical trends
and actual receipts year to date. These increases are offset by decreases in gross receipts fees on telephone. Other
fees remain flat for FY2019.
Licenses and Permits
Licenses and Permits are primarily made up of building, residential, alarm and health permit fees. Revenues in this
category are anticipated to increase by $893k or 5.5 percent from the FY2018 budget. The increase is due to higher
fees for planning and increases in building permits which are economy driven.
Intergovernmental Revenue
Revenue from other government agencies is mainly made up of reimbursement for indirect costs. Revenues in
this category are projected to decrease by $31k or 8.4 percent from the FY2018 budget.
Charges for Services
Service Charges are mainly made up of administrative service charges, allocations for technology services,
deferred and penalty fees for court services, plan review fees, gas well annual fees, registration fees, site
reservations, planning commission fees, mowing fees, and fire inspection fees. Revenues in this category
increased $10.9 million from the FY2018 budget or 40.9 percent. This change is primarily from technology fees
due to the incorporation of the Information Technology Department from an internal service fund into the General
Fund.
62