Page 560 - Fort Worth City Budget 2019
P. 560

City Profile


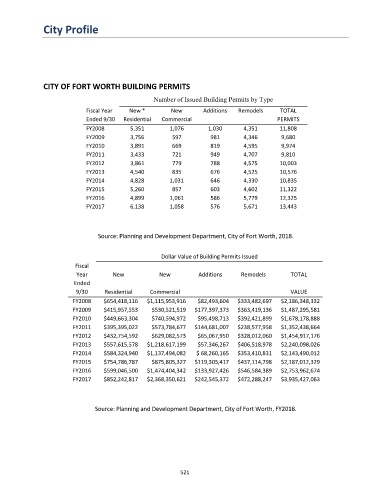
               CITY OF FORT WORTH BUILDING PERMITS

                                                    Number of Issued Building Permits by Type
                              Fiscal Year   New *         New       Additions   Remodels      TOTAL
                              Ended 9/30  Residential  Commercial                            PERMITS
                              FY2008        5,351        1,076        1,030       4,351       11,808
                              FY2009        3,756         597          981        4,346       9,680
                              FY2010        3,891         669          819        4,595       9,974
                              FY2011        3,433         721          949        4,707       9,810
                              FY2012        3,861         779          788        4,575       10,003
                              FY2013        4,540         835          676        4,525       10,576
                              FY2014        4,828        1,031         646        4,330       10,835
                              FY2015        5,260         857          603        4,602       11,322
                              FY2016        4,899        1,061         586        5,779       12,325
                              FY2017        6,138        1,058         576        5,671       13,443


                                 Source: Planning and Development Department, City of Fort Worth, 2018.


                                                      Dollar Value of Building Permits Issued
                          Fiscal
                          Year        New             New          Additions     Remodels        TOTAL
                          Ended
                          9/30      Residential    Commercial                                    VALUE
                         FY2008    $654,418,116   $1,115,953,916  $82,493,604   $333,482,697  $2,186,348,332
                         FY2009    $415,957,553    $530,521,519  $177,397,373   $363,419,136  $1,487,295,581
                         FY2010    $449,663,304    $740,594,972   $95,498,713   $392,421,899  $1,678,178,888
                         FY2011    $395,395,022    $573,784,677  $144,681,007   $238,577,958  $1,352,438,664
                         FY2012    $432,754,592    $629,082,573   $65,067,950   $328,012,060  $1,454,917,176
                         FY2013    $557,615,578   $1,218,617,199  $57,346,267   $406,518,978  $2,240,098,026
                         FY2014    $584,324,940   $1,137,494,082  $ 68,260,165  $353,410,831  $2,143,490,012
                         FY2015    $754,786,787    $875,805,327  $119,305,417   $437,114,798  $2,187,012,329
                         FY2016    $599,046,500   $1,474,404,342  $133,927,426  $546,584,389  $2,753,962,674
                         FY2017    $852,242,817   $2,368,350,621  $242,545,372  $472,288,247  $3,935,427,063


                                Source: Planning and Development Department, City of Fort Worth, FY2018.


                                                             521
   555   556   557   558   559   560   561   562   563   564   565