
Page 138 - Honorable Mayor and Members of the City Council
P. 138
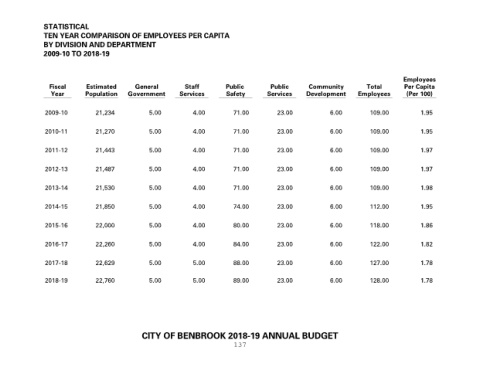
STATISTICAL
               TEN YEAR COMPARISON OF EMPLOYEES PER CAPITA
               BY DIVISION AND DEPARTMENT
               2009-10 TO 2018-19


                                                                                                                                      Employees
                 Fiscal      Estimated        General         Staff         Public        Public       Community          Total       Per Capita
                  Year       Population    Government       Services        Safety       Services     Development      Employees       (Per 100)


                2009-10          21,234           5.00           4.00         71.00         23.00             6.00         109.00           1.95


                2010-11          21,270           5.00           4.00         71.00         23.00             6.00         109.00           1.95


                2011-12          21,443           5.00           4.00         71.00         23.00             6.00         109.00           1.97


                2012-13          21,487           5.00           4.00         71.00         23.00             6.00         109.00           1.97

                2013-14          21,530           5.00           4.00         71.00         23.00             6.00         109.00           1.98

                2014-15          21,850           5.00           4.00         74.00         23.00             6.00         112.00           1.95

                2015-16          22,000           5.00           4.00         80.00         23.00             6.00         118.00           1.86

                2016-17          22,260           5.00           4.00         84.00         23.00             6.00         122.00           1.82

                2017-18          22,629           5.00           5.00         88.00         23.00             6.00         127.00           1.78

                2018-19          22,760           5.00           5.00         89.00         23.00             6.00         128.00           1.78


                                                CITY OF BENBROOK 2018-19 ANNUAL BUDGET
                                                                              137