
Page 17 - City of Arlington FY19 Adopted Operating Budget
P. 17
Budget In Brief
FY 2019 ADOPTED GENERAL FUND REVENUES
The City’s revenue outlook shows continuing improvement. The strength in the City’s housing and construction industries has
resulted in another significant increase in ad valorem revenues. Sales tax revenue growth has gradually slowed since FY 2016;
these revenues are budgeted at 3.1% above the FY 2018 estimated amount. The assessed value of the City’s property is up
9.8% from last year. The following table provides a summary of General Fund revenues by major category for FY 2017 Actuals,
FY 2018 Estimates, and FY 2019 Adopted.
FY 2017 Actuals FY 2018 Estimates FY 2019 Adopted
Property Taxes $ 90,888,160 $ 98,437,542 $ 107,777,324
Sales Taxes 59,924,982 62,564,461 64,503,959
Franchise Fees 36,872,434 38,536,538 37,893,359
Service Charges 14,762,385 14,369,124 16,222,464
Fines and Forfeitures 11,148,528 10,028,501 9,928,501
Other Revenues 17,291,501 17,591,391 18,625,067
Total Revenues $ 230,887,990 $ 241,527,557 $ 254,950,675
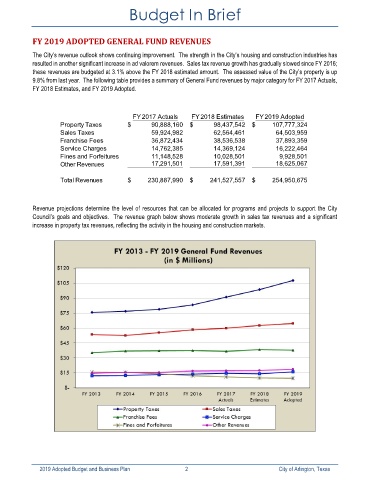
Revenue projections determine the level of resources that can be allocated for programs and projects to support the City
Council’s goals and objectives. The revenue graph below shows moderate growth in sales tax revenues and a significant
increase in property tax revenues, reflecting the activity in the housing and construction markets.
2019 Adopted Budget and Business Plan 2 City of Arlington, Texas