
Page 125 - City of Arlington FY19 Adopted Operating Budget
P. 125
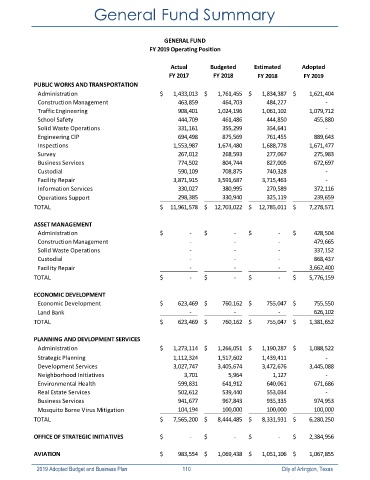
General Fund Summary


                                                       GENERAL FUND
                                                   FY 2019 Operating Position

                                                         Actual        Budgeted      Estimated       Adopted
                                                         FY 2017        FY 2018       FY 2018        FY 2019
            PUBLIC WORKS AND TRANSPORTATION
              Administration                          $         1,433,013 $          1,761,455 $          1,834,387 $            1,621,404

              Construction Management                                 463,859                 464,703                 484,227                            ‐
              Traffic Engineering                                     908,401             1,024,196             1,061,102               1,079,712
              School Safety                                           444,709                 461,486                 444,850                   455,880
              Solid Waste Operations                                  331,161                 355,299                 354,641                            ‐
              Engineering CIP                                         694,498                 875,569                 761,455                   889,643
              Inspections                                         1,553,987             1,674,480             1,688,778               1,671,477
              Survey                                                  267,012                 268,593                 277,067                   275,983
              Business Services                                       774,502                 804,744                 827,005                   672,697
              Custodial                                               590,109                 708,875                 740,328                            ‐
              Facility Repair                                     3,871,915             3,591,687             3,715,463                            ‐
              Information Services                                    330,027                 380,995                 270,589                   372,116
              Operations Support                                      298,385                 330,940                 325,119                   239,659
            TOTAL                                     $       11,961,578 $       12,703,022 $       12,785,011 $            7,278,571


            ASSET MANAGEMENT
              Administration                          $                      ‐  $                      ‐  $                      ‐  $                 428,504
              Construction Management                                          ‐                           ‐                            ‐                    479,665
              Solid Waste Operations                                           ‐                           ‐                          ‐                      337,152
              Custodial                                                        ‐                           ‐                            ‐                    868,437
              Facility Repair                                                   ‐                          ‐                              ‐                3,662,400
            TOTAL                                     $                      ‐  $                      ‐  $                      ‐  $            5,776,159

            ECONOMIC DEVELOPMENT
              Economic Development                    $             623,469 $             760,162 $             755,047 $                755,550
              Land Bank                                                         ‐                             ‐                           ‐                    626,102
            TOTAL                                     $             623,469 $             760,162 $             755,047 $            1,381,652

            PLANNING AND DEVLOPMENT SERVICES

              Administration                          $         1,273,114 $          1,266,051 $          1,190,287 $            1,088,522
              Strategic Planning                                  1,112,324             1,517,602             1,439,411                            ‐
              Development Services                                3,027,747             3,405,674             3,472,676               3,445,088
              Neighborhood Initiatives                                    3,701                     5,964                     1,127                            ‐
              Environmental Health                                    599,831                 641,912                 640,061                   671,686
              Real Estate Services                                    502,612                 539,440                 553,034                            ‐
              Business Services                                       941,677                 967,843                 935,335                   974,953
              Mosquito Borne Virus Mitigation                         104,194                 100,000                 100,000                   100,000
            TOTAL                                     $           7,565,200 $          8,444,485 $          8,331,931 $            6,280,250


            OFFICE OF STRATEGIC INITIATIVES           $                      ‐  $                      ‐  $                      ‐  $            2,384,956

            AVIATION                                  $             983,554 $          1,069,438 $          1,051,106 $            1,067,855

             2019 Adopted Budget and Business Plan                                        110                                                                  City of Arlington, Texas