
Page 195 - FY 2021-22 ADOPTED BUDGET
P. 195
DIVISION SUMMARY FY 2025-26 BUDGET
Function Department Division Account
PUBLIC SAFETY POLICE MANAGEMENT SERVICES 01-31-01
DIVISION DESCRIPTION:
The Chief of Police manages and coordinates the activities of the Police Department. He also administers the budget for all Police Activities including:
Communications/Records, Patrol, Criminal Investigation Section, Crime Prevention, School Safety, and Animal Control. Management Services is staffed by the
Chief of Police and the Administrative Manager.
DIVISION GOALS:
• To coordinate and manage the resources of the Police Department so that the City will provide the best possible law
enforcement and crime prevention services to the residents of Benbrook.
DIVISION OBJECTIVES:
• To monitor expenditures and remain within + or - 5% of the Activity's budget allocation.
• To manage the Police Department so as to provide prompt delivery of quality law enforcement service.
• To work toward upgrading police equipment to provide improved service to Benbrook's residents.
• To conduct the employee selection and training process in an effort to retain highly qualified, well-trained personnel.
• To keep employee turnover under 4% annually.
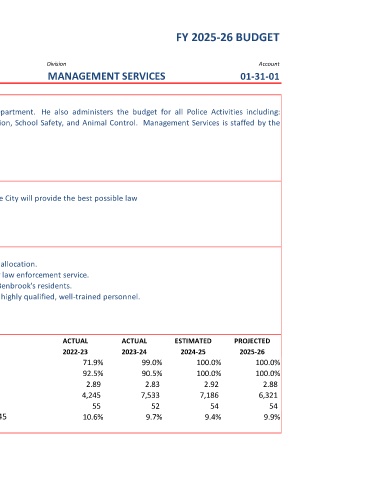
DIVISION MEASUREMENTS: ACTUAL ACTUAL ESTIMATED PROJECTED
2022-23 2023-24 2024-25 2025-26
Percent of Budget Expended - Management Services 71.9% 99.0% 100.0% 100.0%
Percent of Budget Expended - Police Department 92.5% 90.5% 100.0% 100.0%
Average Response Time in Minutes 2.89 2.83 2.92 2.88
Number of Training Hours 4,245 7,533 7,186 6,321
Number of Employees in Training 55 52 54 54
Annual Employee Turnover Percentage 145 10.6% 9.7% 9.4% 9.9%